- Išsiųsime per 10–14 d.d.
- Autorius: John J Murphy
- Leidėjas: Wiley
- ISBN-10: 0470382058
- ISBN-13: 9780470382059
- Formatas: 15.5 x 22.9 x 3.6 cm, kieti viršeliai
- Kalba: Anglų
- Extra -15 % nuolaida šiai knygai su kodu: ENG15
Atsiliepimai
Aprašymas
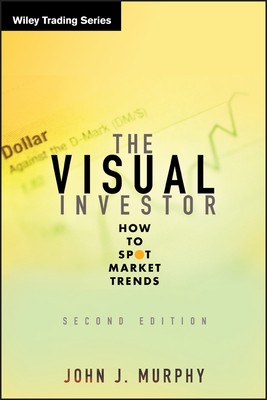
The Visual Investor, Second Edition breaks down technical analysis into terms that are accessible to even individual investors. Aimed at the typical investor--such as the average CNBC viewer--this book shows investors how to follow the ups and downs of stock prices by visually comparing the charts, without using formulas or having a necessarily advanced understanding of technical analysis math and jargon. Murphy covers all the fundamentals, from chart types and market indicators to sector analysis and global investing, providing examples and easy-to-read charts so that any reader can become a skilled visual investor.
EXTRA 15 % nuolaida su kodu: ENG15
Akcija baigiasi už 6d.16:44:52
Nuolaidos kodas galioja perkant nuo 10 €. Nuolaidos nesumuojamos.

- Autorius: John J Murphy
- Leidėjas: Wiley
- ISBN-10: 0470382058
- ISBN-13: 9780470382059
- Formatas: 15.5 x 22.9 x 3.6 cm, kieti viršeliai
- Kalba: Anglų
The Visual Investor, Second Edition breaks down technical analysis into terms that are accessible to even individual investors. Aimed at the typical investor--such as the average CNBC viewer--this book shows investors how to follow the ups and downs of stock prices by visually comparing the charts, without using formulas or having a necessarily advanced understanding of technical analysis math and jargon. Murphy covers all the fundamentals, from chart types and market indicators to sector analysis and global investing, providing examples and easy-to-read charts so that any reader can become a skilled visual investor.


Atsiliepimai